Muslims in America: Part 1
An Analysis of the Muslim Population in U.S. States and its Relationship with Political Orientation
This article presents an analysis of the distribution of the Muslim population across U.S. states in relation to their historical political orientations. The study reveals intriguing patterns and insights that underscore the diverse demographic landscape of the United States and the varied distribution of religious groups across different states and political leanings.
The United States, known for its cultural and religious diversity, has a significant Muslim population that varies widely across its different states. In this analysis, we explore the distribution of the Muslim population across U.S. states, and examine these patterns in relation to the historical political orientations of the states - categorized as Democrat (blue), Republican (red), or swing.
Data and Methodology
The Muslim population data is sourced from a 2020 survey, which provides the number and percentage of Muslims in each U.S. state. The states' political orientations are classified based on their voting patterns in recent presidential elections up until 2020. The states are categorized into blue (historically Democrat), red (historically Republican), or swing states.
Results
The data shows a wide range in both the number and percentage of Muslims across the different states and political orientations.
Muslim Population and Blue States
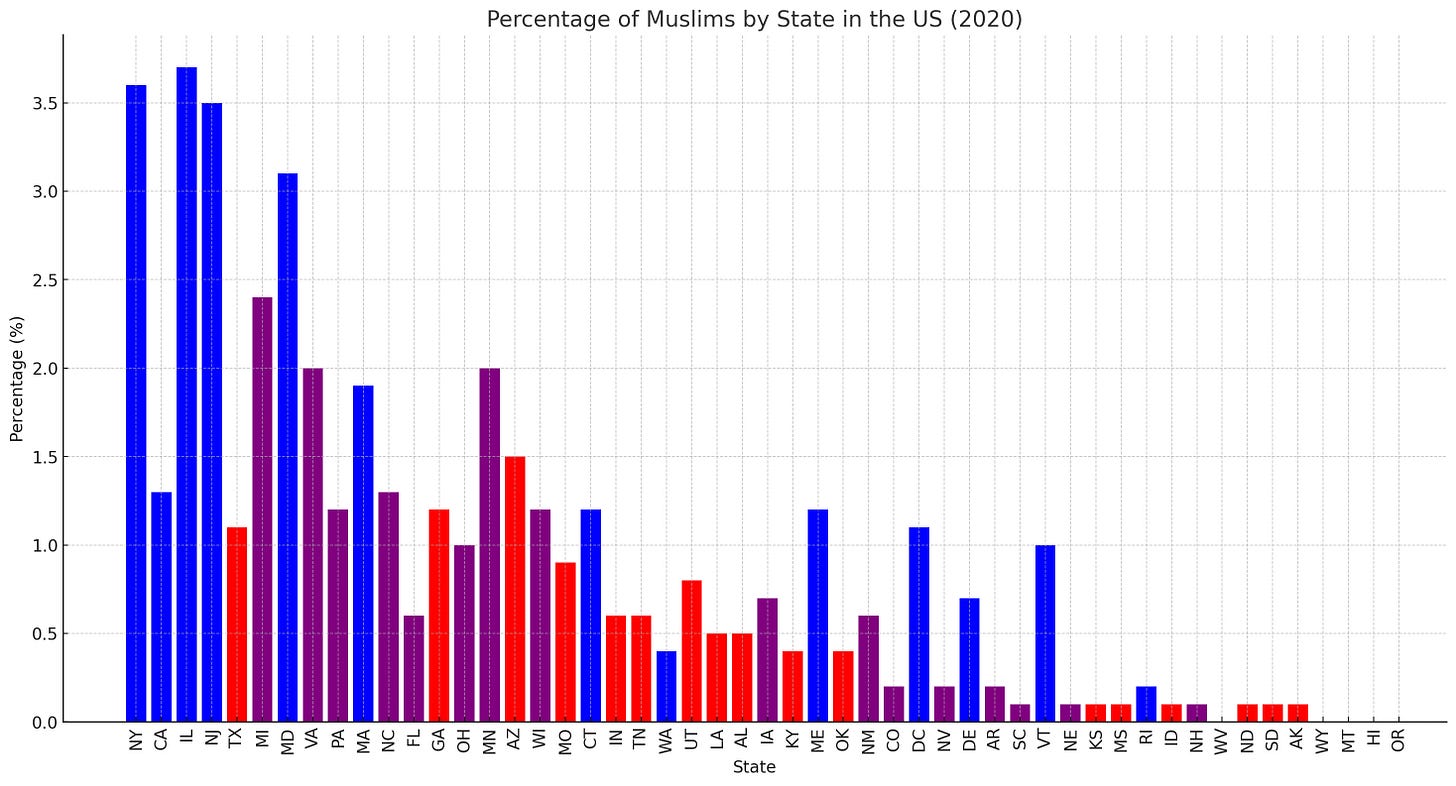
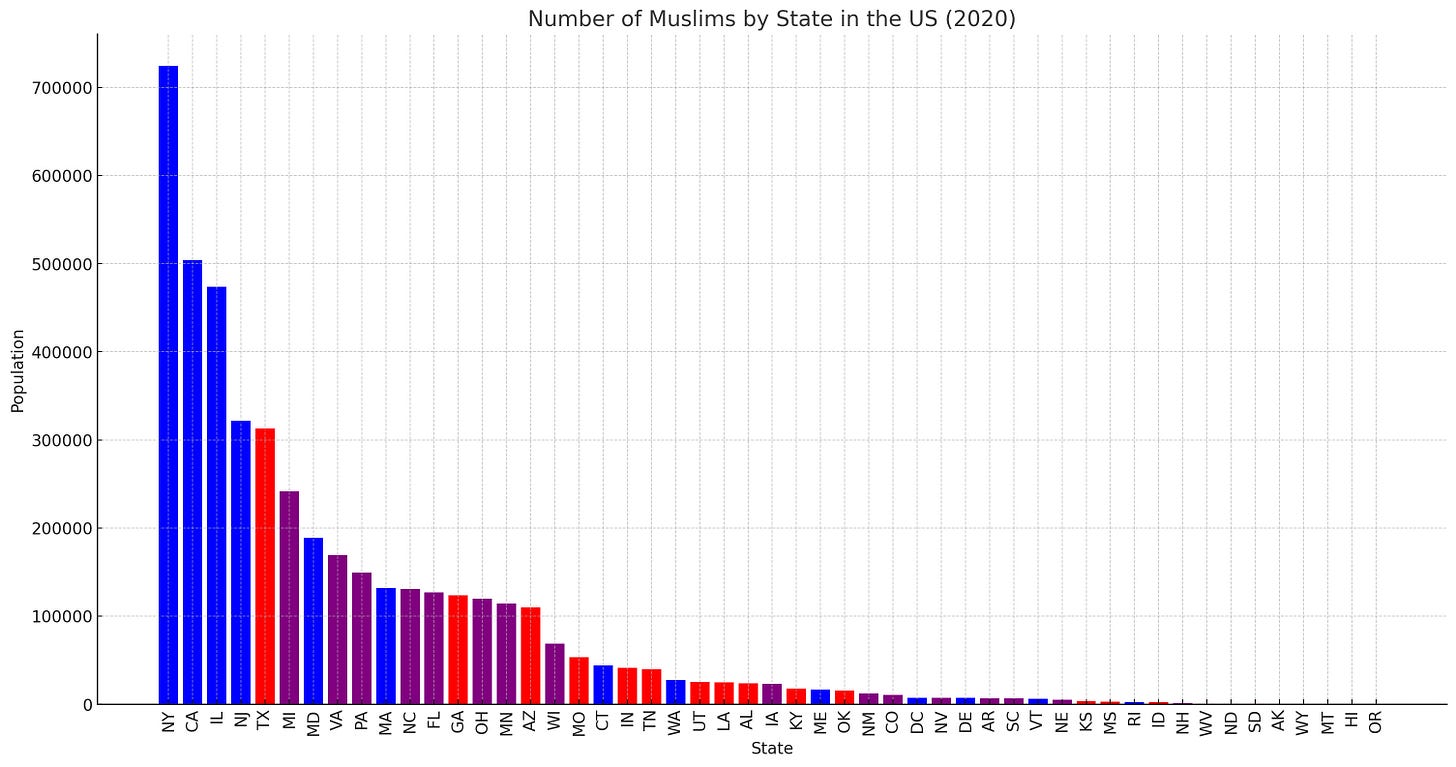
Historically Democrat or "blue" states such as New York, California, and Illinois have large Muslim populations. This could be attributed to the large urban centers in these states, which tend to attract diverse populations. However, the percentage of Muslims in these states varies, with Illinois having the highest percentage among them.
Muslim Population and Red States
In the traditionally Republican or "red" states, there is a significant variation in the Muslim population. Texas, for instance, has a high Muslim population, contrasting with other red states like Wyoming and Montana, which have very low Muslim populations. Factors such as overall population size and the presence of major cities could contribute to these variations.
Muslim Population and Swing States
In swing states, we observe a wide range of Muslim populations. Florida and North Carolina, for example, have relatively high Muslim populations, whereas New Hampshire and New Mexico have much lower Muslim populations.
Percentage of Muslims vs. Political Orientation
The percentage of Muslims does not show a clear relationship with the political orientation of a state. For instance, Illinois, a blue state, has the highest percentage of Muslims, whereas Utah, a red state, also has a relatively high percentage of Muslims. This underscores the fact that religious demographics are influenced by multiple factors and are not solely determined by political orientation.
Conclusion
This analysis reveals intriguing patterns in the distribution of the Muslim population across U.S. states in relation to their political orientations. The findings underscore the diverse demographic landscape of the U.S. and the varied distribution of religious groups across different states and political leanings. However, it is important to note that these patterns are influenced by a myriad of factors and can change over time. Further research is needed to explore the complexities of these relationships and the factors influencing them.


